Friday, August 8, 2008
Nominal Area Choropleth Map

Index Value Plot


http://water.usgs.gov/waterwatch/?m=real&r=ga&w=real%2Cplot
This index value plot represents the streamflow for
plot represents daily values; there is no limit to the values that could be used. I wanted to compare FL to GA
mainly due to the drought conditions in
Trellis Plot

http://www.cs.umd.edu/class/spring2001/cmsc838b/Apps/presentations/Jaime_Spacco/
This graph or plot is the second part of the next post about football...this graph is broken down by team, using only wins, running offense, and running defense. I thought this was a fun graph, one that may be helpful to fantasy football fanatics.
Parallel Coordinate Graph

http://www.cs.umd.edu/class/spring2001/cmsc838b/Apps/presentations/Jaime_Spacco/
Box Plot

Vertical axis: Response variable
Horizontal axis: The factor of interest
More specifically, we
- Calculate the median and the quartiles (the lower quartile is the 25th percentile and the upper quartileis the75th percentile).
- Plot a symbol at the median (or draw a line) and draw a box (hence the name--box plot) between thelower and upper quartiles; this box represents the middle 50% of the data--the "body" of the data.
- Draw a line from the lower quartile to the minimum point and another line from the upper quartile tothe maximum point. Typically a symbol is drawn at these minimum and maximum points, althoughthis is optional.
Similarity Matrix
A similarity matrix is used in determining the similarity between two sets of data. This matrix is compiled by using the Smith-Waterman algorithm. This algorithm finds determines the similarity between protein sequences.
Stem and Leaf
Histogram

http://www.socialresearchmethods.net/kb/statcorr.php
A histogram is a graphical representation of a data set. A histogram is probably one of the earliest graphs a elementary student learns how to read/make. Of course as a child we called them bar graphs...nothing as fancy as a histogram.
This histogram is a list of heights and the frequency in which they occur. This is something very similar to what I did in school, however this one was a part of a correlation study in which height was correlated to self-esteem.
Correlation Matrix
Thursday, August 7, 2008
Bilateral Graph

Climagraph
I have included the instructions that were on the website.

1. The type of biome associated with the place.
2. The place where the temperature and precipitation were measured.
3. A scale used to indicate inches of precipitation.
4. The months of the year. The letters J, F, M, etc., stand for January, February, March, etc.
5. The temperature scale in degrees Fahrenheit.
6. A bar graph showing the average precipitation for each month. In this example, the average total precipitation is about 1 inch in January and nearly 4 inches in August. (Note: Values for this graph are found on the left-hand scale.)
7. A line graph showing monthly temperature during the year. In this example, the lowest temperature is about -5°F in January and the highest is about 45°F in July. (Note: Values for this graph are found on the right-hand scale.)
Lorenz Curve
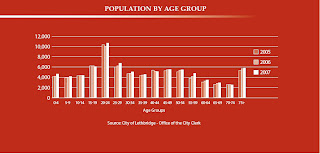
Population Profile
Wednesday, August 6, 2008
Triangle Plot

Wind Rose
Univariate Choropleth Map

Bivariate Choropleth Map

http://www.spokane.wsu.edu/gis/Classes/davis/uc1.jpg
A bi-variate choropleth map only contains two variables. In this particular example the two variables are residential and business land use patterns.
Unclassed Choropleth Map
Classed Choropleth Map

oldbushie.blogspot.com/ 2007/10/map-of-week.html
Sunday, August 3, 2008
Star Plot

http://www.itl.nist.gov/div898/handbook/eda/section3/starplot.htm
This star plot map is based on 16 cars. Each of the radii represents a different variable of the car. The variables range from cost to mileage to size and interior space. The connecting line of the circle crosses the radii according to its rank, the further out, the greater the rank.
Continuously Variable Proportional Circle Map

http://gsc.nrcan.gc.ca/mindep/metallogeny/sedex/selwyn/index_e.php
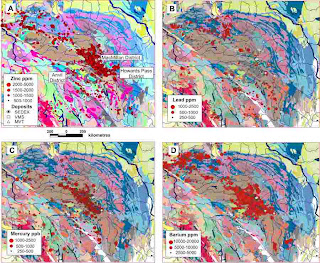
This is an example of a Continuously Variable Proportional Circle Map. This map
represents the distribution of minerals in sediment of streams that drain the Selwyn
Basin, Yukon, Canada. The variables in this map are the amounts and location of minerals in the streams.
Proportional Circle Map

DEM
http://www.digitalmapdata.com/images/dem_NasaSrtm_Tasmania_Ex.jpg
 This DEM (Digital Elevation Model) compares DEM images of Tasmania as taken from two different sources. The image on the left is from the SRTM or Shuttle Radar Topography Mission. The images on the right are from a GADDS 9 Second DEM. The difference in the detail is amazing.
 DOQQ
 www.soest.hawaii.edu/.../ data/hawaii/index.html
DLG

oregonexplorer.info/ craterlake/dlg.html
DRG

oregonexplorer.info/ craterlake/dlgv32.html
Isopleth

dwb.unl.edu/.../library/ weekly/aa071600a.htm
Isohyet

www.comet.ucar.edu/.../ c11_28jul97/lab1.htm
This isohyet map shows rainfall over
Isotachs
Isobars

www.silweather.com/ mapindx.html
LIDAR

 jerz.setonhill.edu/ design/WTC/index.html
Saturday, August 2, 2008
Doppler Radar Image
 www.srh.noaa.gov/tlh/ wxevents/alberto061306.html
B&W Aerial Photo

www.ww2incolor.com/. ../dday_aerial
Infrared Aerial Photo
Cartographic Animation
 http://commons.wikimedia.org/wiki/Image:Hurricane_Elena_NOAA.gif
Statistical Map

www.floridahurricane.net/
Cartogram


Flow Map

www.vtvt.ece.vt.edu/ vlsidesign/designFlow.php


