
www.vtvt.ece.vt.edu/ vlsidesign/designFlow.php
This an example of a flow map. A flow map can be represented in different ways. This particular one is a sample of a design process.

 http://www.directionsmag.com/images/newsletter/2007/01_18/HIV_Map_lg.jpg
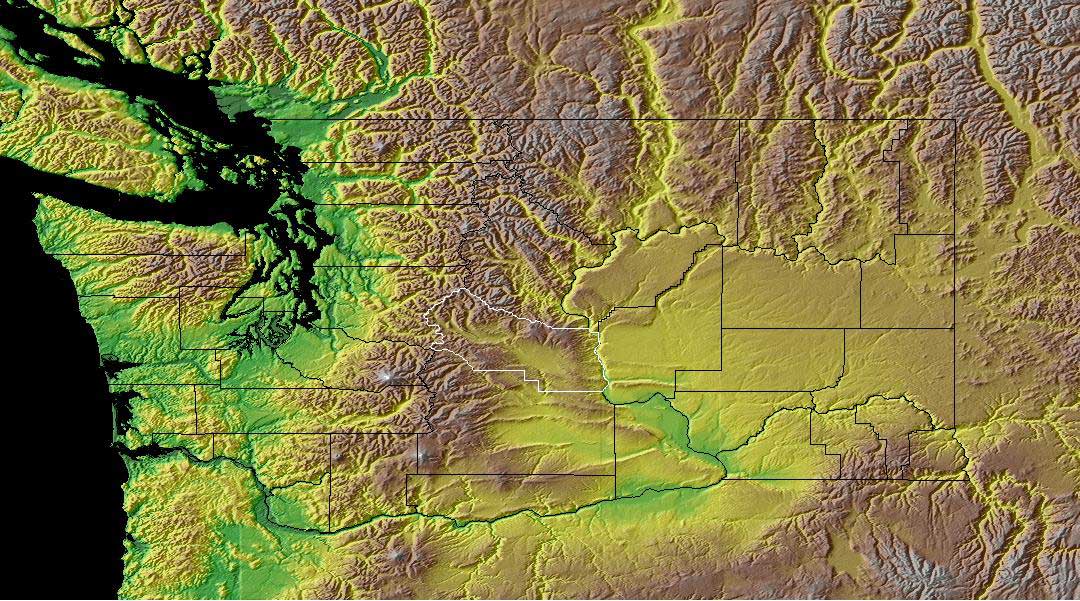 Once again a map of Washington state. This is one of my favorite places. We really enjoyed our time there and this map represents why. We lived in Tacoma on the western side of the state where it is green.This area gets a lot of rain and is very green. The brown area are the mountains. In the early spring you could wear shorts and then drive to the mountains where it is snowy. On the eastern side of the state it is more desert-like. The Army uses the large gold colored area in the middle to simulate desert conditions.

 This is a propaganda map of obesity in the United States. Notice how the cups form the image of McDonalds. The idea behind the map was to challenge businesses, designers, and builders to take on the obesity problem in the U.S.
 This map from Google Earth is using a KML for recent earthquake activity. I found this particular KML file interesting because I didn't realize how many earthquakes occur on a daily basis. The map was very easy to use and navigate; it seemed to be an enhancement to Google Earth. I found other sites and KML files and even did a search for KML files with a certain keyword. I had a lot of fun with this exercise and will use this application of KML files again.

